Snow Plow tracker
An application that shows live plowing road conditions to help drivers travel safely in snowy road conditions.
Duration: 13 weeks
Coursework: User Experience methodology
Type of coursework: Group project with a team of 5
Software used: Figma, Mural, Adobe Illustrator
PROBLEM STATEMENT
Driving in the winter has been one of many drivers' biggest safety driving challenges.
Drivers may skid or lose control of their vehicles more easily due to the slippery road. When the snowfall is heavy, snow plowers might take longer time to clear the road for drivers to travel safely. Based on a statistic by the U.S Department of Transportation:
"Each year, over 1,300 people are killed and more than 116,800 people are injured in vehicle crashes on snowy, slushy or icy pavement annual."
U.S Department of Transportation
U.S Department of Transportation Federal Highway Administration

QUESTION STATEMENT
How might we find a way to better inform drivers of cleared and uncleared roads and give live updates on the safest and best routes to travel?
LEAN CANVAS
To help our team focus on “why” we are doing this, a Lean UX Canvas was used.
Using the Lean UX Canvas by Jeff Gothelf, our team brainstormed the business and user needs and created a few hypotheses on Mural. One of the hypotheses shown above stated:

Summary point
-
Our initial hypothesis is that we believe a reduction of vehicles will be achieved if drivers attain more informed knowledge of road conditions with our snow plow tracker app
USER PERSONA
Meet Delivery Dan
One of our four user personas was created to represent a user type that might use our snow plow tracker app.

Summary point
Delivery Dan needs a system that provides live road conditions to keep customers happy by delivering the pizzas on time during the winter season.
QUALITATIVE RESEARCH
Discovering insights from real people
Seven virtual interviews and an online survey questionnaire were created to generate knowledge about our users, their experiences driving in the snow, and their pain points.

Interview questions to gain a better understanding of our users

Online survey was sent to the team member's personal network to collect more data
AFFINITY MAPPING
Uncovering insights from the interviews and surveys
An affinity mapping is created to categorize and sort all qualitative research data based on similar points. This also helped our team to extract relevant insights and distill patterns from the qualitative data.

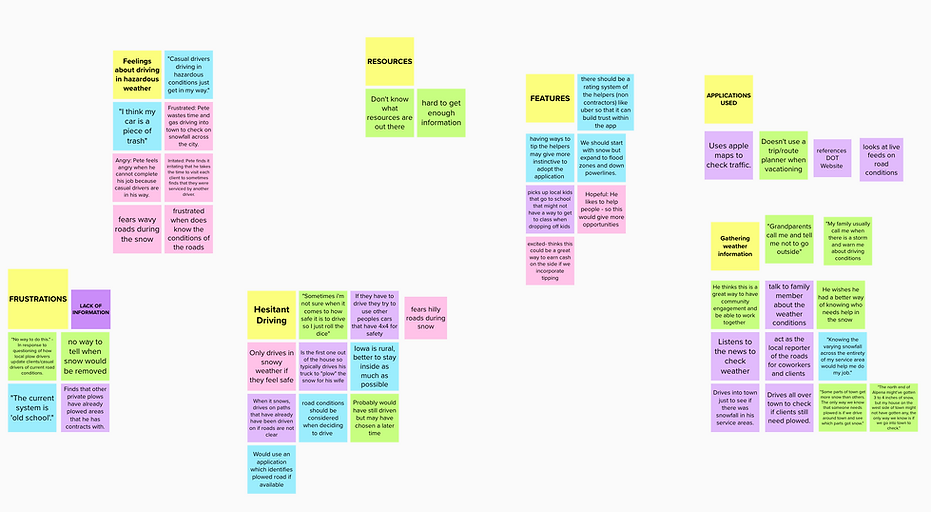
Summary point
-
Users feel anxious when driving in hazardous conditions
-
Users do not know where to get live updates about road conditions
-
Some users feel frustrated because there was no way to tell when the roads have been cleared
-
Some users use a weather app to check for the snow percentage
EMPATHY MAP
Understanding Delivery Dan's emotions from affinity mapping
An affinity mapping is created to categorize and sort all qualitative research data based on similar points. This also helped our team to extract relevant insights and distill patterns from the qualitative data.

Summary point
-
Delivery Dan expressed that the delivery job is tough because of the risk of getting into an accident
-
He wants to know which road has been plowed to reduce the anxiety from his family
-
He uses Google Maps to plan his delivery route ahead
USER JOURNEY
A walkthrough of Delivery Dan's journey delivering pizza during heavy snow weather
From the empathy map, we created an information
.png)
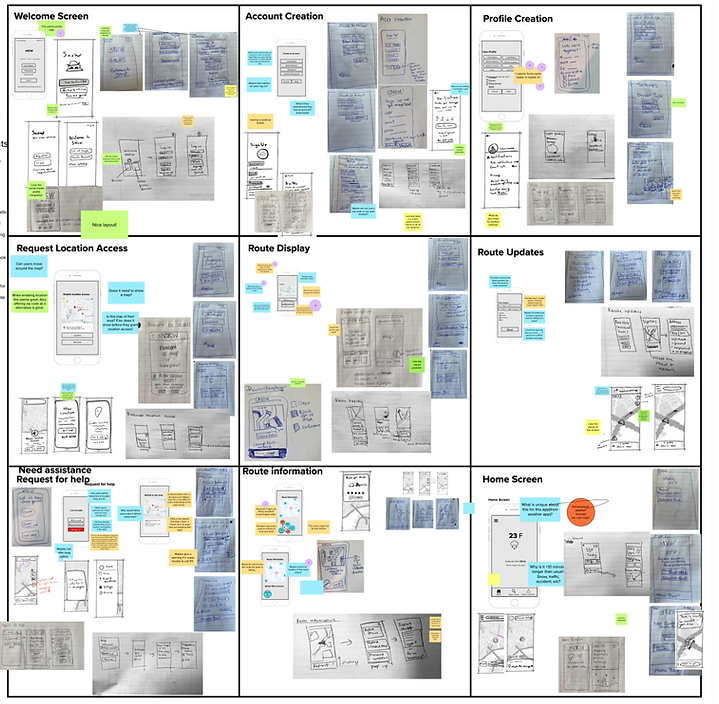
IDEATIONS
Turning user flows into wireframes to help Delivery Dan with his pizza delivery
From the empathy map, we created an information

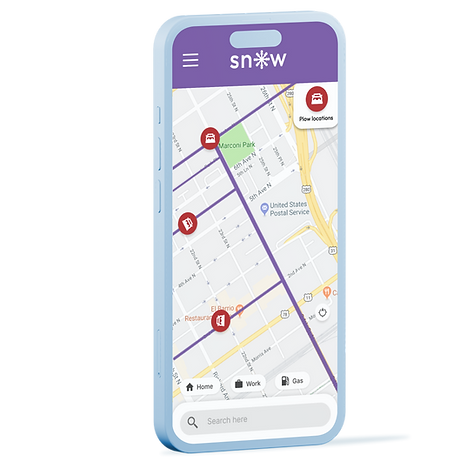
RESULTS
High-fidelity screens of how Delivery Dan would use this app to view the plow trucks and cleared roads on a navigation map.


REFLECTION
After four months of applying UX methodologies to create a snow plow tracker app in a team settings, here are some insights I've gained:
What was the most challenging part?
-
Collaborated with team members across different time zones
-
Removing assumptions from the team in the design stage
What was the most enjoyable part?
-
End-to-end process from defining the problem, doing research, and implementing insights into designs
-
Collaborated with a team to share ideas and opinions
What did I learn from this?
-
Research is crucial to understand user behavior and needs
-
Using Lean UX (agile) approach to solve problems
What were the success?
-
Applying different UX methodology into one project
-
Made meaningful connections with my team members
What were the failures?
-
The content from the Lean UX canvas was based on our assumptions.
-
Lack of research and discovery in order to validate or invalidate our assumptions on the final designs
If given more time...
-
Our team would conduct user testing to find out usability problems and UI designs according to users' needs and expectations.